Subsea cable exposure and anchor drag: what satellites can and cannot see
If you manage offshore wind cables, the first step to fewer third-party faults is to see subsea cable exposure risk and the vessels above it together.
An offshore wind farm has array cables linking turbines and export cables linking the farm to shore. They are protected by burial, but the cover does not stay as installed. When the seabed moves, the cover thins, and at some point the cable may be exposed.
Cables are long, and most segments are checked only at routine surveys. It is hard to know which segment has thinned or whether a ship has been sitting above it. A cable fault means lost generation and a long repair, so finding the risky segments first matters.
Below we explain why exposure happens, why anchors and fishing gear are the main threat, what satellites can and cannot see, and how TIDEWATCH combines the evidence. If you are deciding which cable segments to survey, take a look.
Category: Cables & satellites
Subsea cable exposure happens where moving sand meets shallow burial
The thickness of soil over a cable is its burial depth. Even the design burial depth changes over time with migrating sand waves, storm erosion and tidal scouring. Burial is not a one-off; the sea keeps moving the cover.
So risk differs along the same cable. The most exposed places are where frequent sand movement, originally shallow burial and frequent vessel traffic overlap. Segments close to turbine foundations are also affected by scour.
How often sand moves can be computed from wave and current data. For each segment, the share of the year in which bed shear exceeds the threshold of motion reveals where the cover is likely to thin.
Water depth is needed too, because waves push harder on a shallow seabed. TIDEWATCH uses public bathymetry that combines charts such as GEBCO with multibeam data for each segment, and replaces it with as-built survey data where available.
Building a cable segment exposure score
Split array and export cables into segments.
Share of time sand moves on each segment.
As-built records or a default.
Distance to vessels detected by radar.
Anchors and fishing gear are the biggest threat to exposed cables
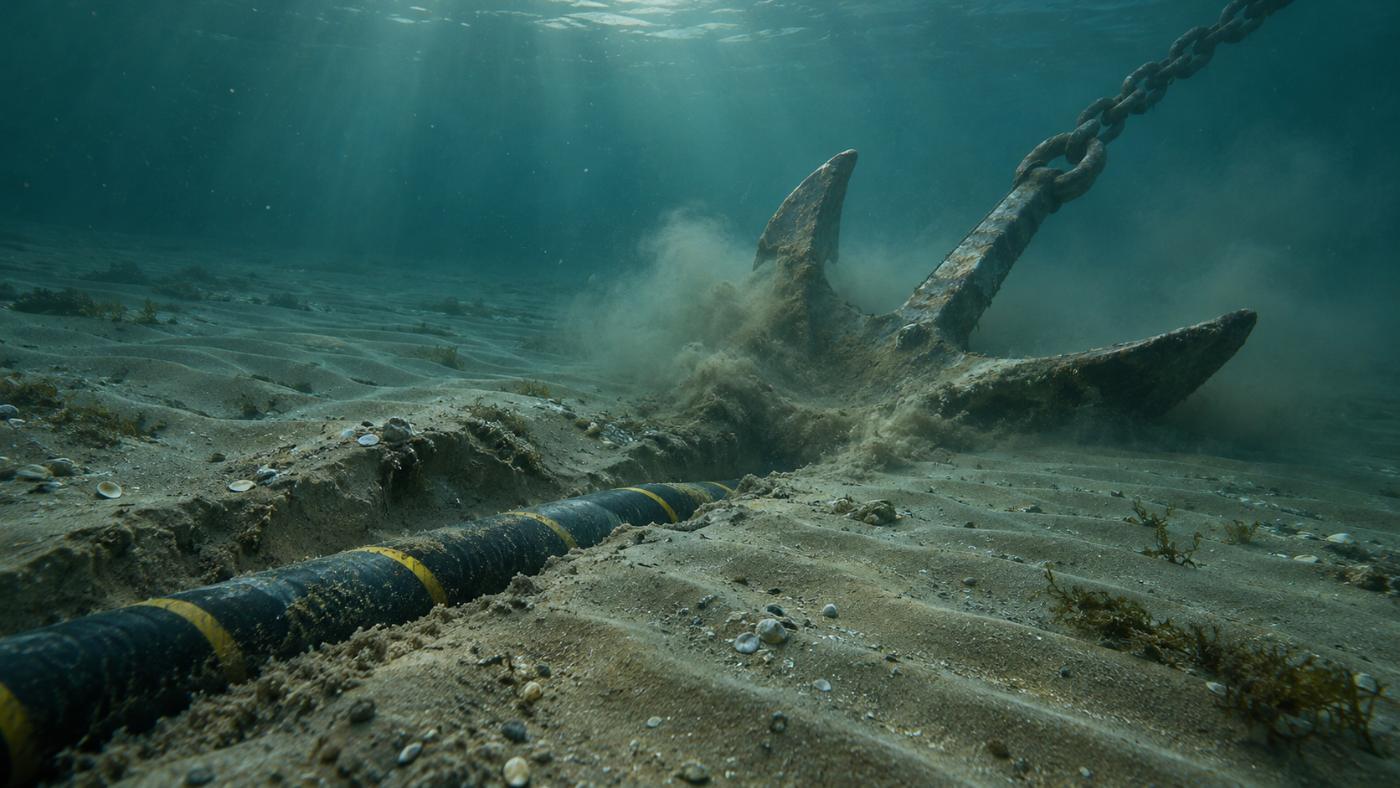
An exposed or shallow cable is easily caught by gear that scrapes the seabed or by a dragging anchor. The International Cable Protection Committee (ICPC) has long identified fishing and anchors as leading causes of subsea cable damage.
Anchor drag usually happens when a ship at anchor is pushed by wind or current. Where vessels often stop near a cable, higher exposure risk also means a higher chance of an incident.
Cable management is therefore not only about the seabed. Priorities come from seeing where the cover may thin and how vessels behave above it.
It also gives operations something to act on. Knowing where ships tend to stop supports discussions with the relevant maritime authorities and stronger notices for cable protection zones.
Subsea cable exposure is invisible to satellites, but the ships above it are not
Satellites cannot see under water, so they cannot tell directly whether a cable is exposed. Radar satellites are, however, good at detecting ships. Sentinel-1 images the same sea every 6–12 days, day or night, through cloud.
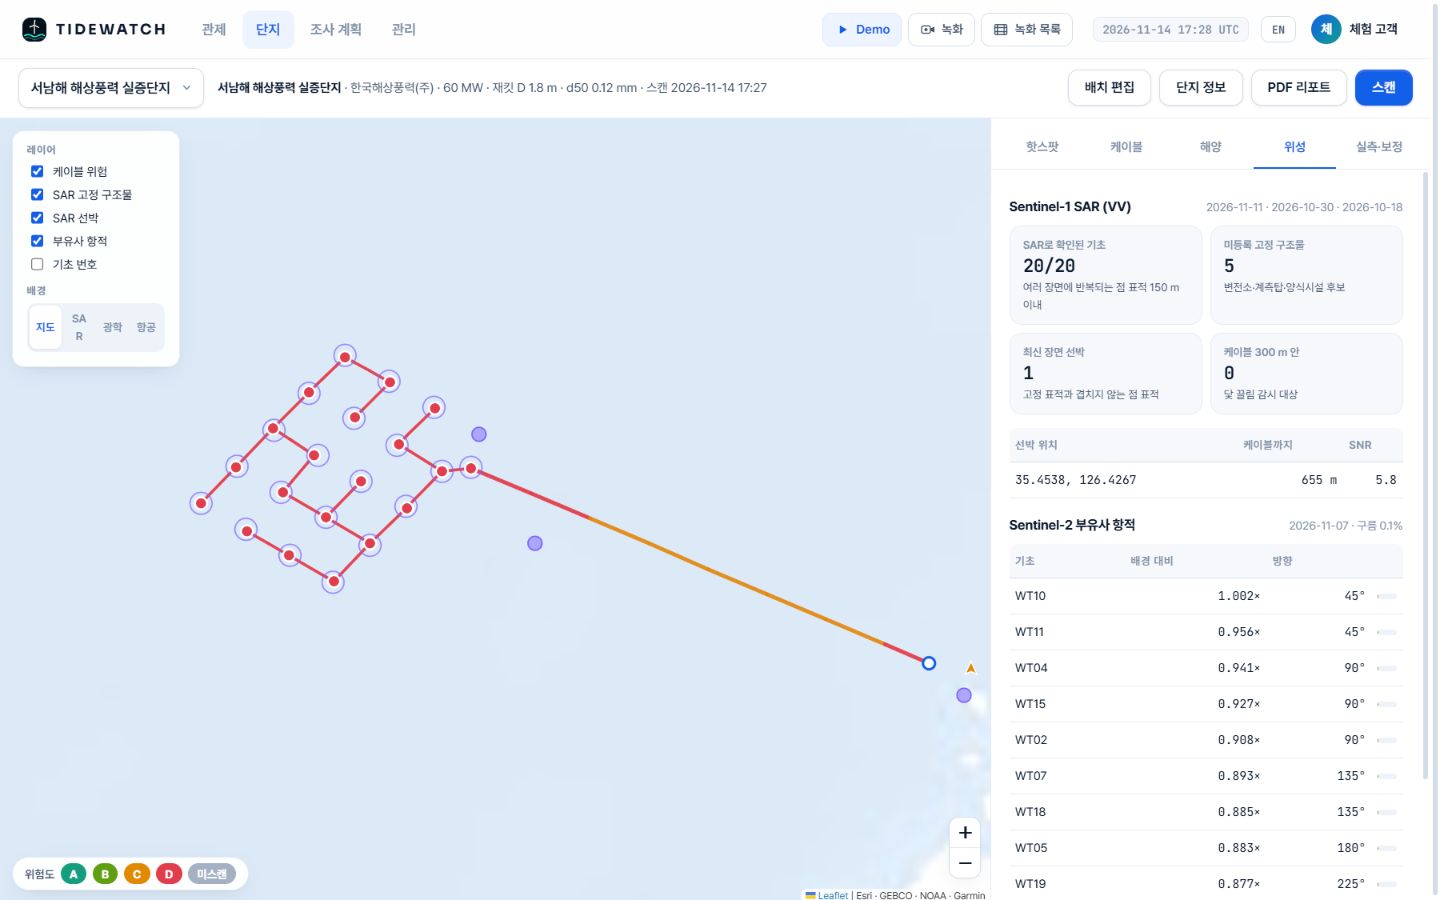
In radar images calm sea looks dark while steel structures and ships appear as bright points. Points that repeat in the same place across scenes are fixed structures such as foundations or substations; points only in the latest scene are likely vessels. Unlike AIS, radar also detects vessels that are not broadcasting.
A single scene is still a snapshot. Vessels passing between scenes are missed, so vessel evidence is one factor in the exposure score rather than a verdict on its own.
TIDEWATCH merges exposure risk and vessel proximity into one score
TIDEWATCH splits cables into segments and multiplies seabed mobility, burial depth and vessel proximity into a 0–100 score. Vessels detected within 300 m of a cable are flagged separately for anchor-drag watch.
In the Southwest Sea demo, built from public information, the latest scene showed one vessel 655 m from the cable. The highest exposure risk was on array string 2 between 1.0 and 1.58 km, with 62% seabed mobility (score 80). This is a pilot calculation with a default burial depth.
Selected segments go into the survey plan for an ROV check, and the results calibrate the score. With as-built burial depth and past exposure records, the score uses real values instead of defaults. Surveying the few highest-scoring kilometres first, rather than the whole length on the same cycle, already shortens vessel time.
We have covered why subsea cable exposure happens and how satellites and ocean models help pick the risky segments; the scoring is described on the cable exposure risk page.
Frequently asked questions
Do we need the cable route?
You can start with a route estimated from the layout. As-built drawings make it more accurate.
Can it be used with AIS?
Yes. AIS gives identity and tracks; radar also catches vessels that do not broadcast. They complement each other.
What if exposure is confirmed?
Add the segment to the survey plan, check it with an ROV, and feed the result back to calibrate the score.
Want to know which foundations and cable segments to survey first?
Send us the farm name. We build the layout from satellite detection and return a first screening report, then calibrate it with your survey records.
Request a pilot analysis →Edited and answered by the MomentCube TIDEWATCH team / james@momentcube.com · +82-32-212-1011