Three seed farms, 250 MW, 110 foundations.
Results of scanning three seed farms, built from public information and satellite detection, in the demo account. They are not operator data or deployments; they show how the calculation and screens work.
Summary
Demo scan of 14 Nov 2026
| Farm | Size | Risk | Main alerts | Survey saving |
|---|---|---|---|---|
| Southwest Sea demonstration (Korea) | 60 MW · 20 jackets · 22.4 km cable | 78 (D) | 1 high-exposure cable segment (Array string 2, 80); 19 foundations at ≥70% of allowance (max 80%); high waves within 7 days | 69.5% |
| Tamra Offshore Wind (Korea) | 30 MW · 10 jackets · 3.5 km cable | 78 (D) | 3 foundations at ≥70% (T10, T09, T08; max 83%); clear plumes at 4 foundations (T03 1.72×); high waves within 7 days | 54.2% |
| Horns Rev 1 (Denmark) | 160 MW · 80 monopiles · 61.6 km cable | 79 (D) | 56 high-exposure cable segments (top: Array string H 4.0–5.0 km, 96) | 77.1% |
Total of 250 MW, 110 foundations and 87.5 km of cable. Demo unit costs. Statutory and insurance surveys should continue for assets that are not high risk.
Horns Rev 1
Screens
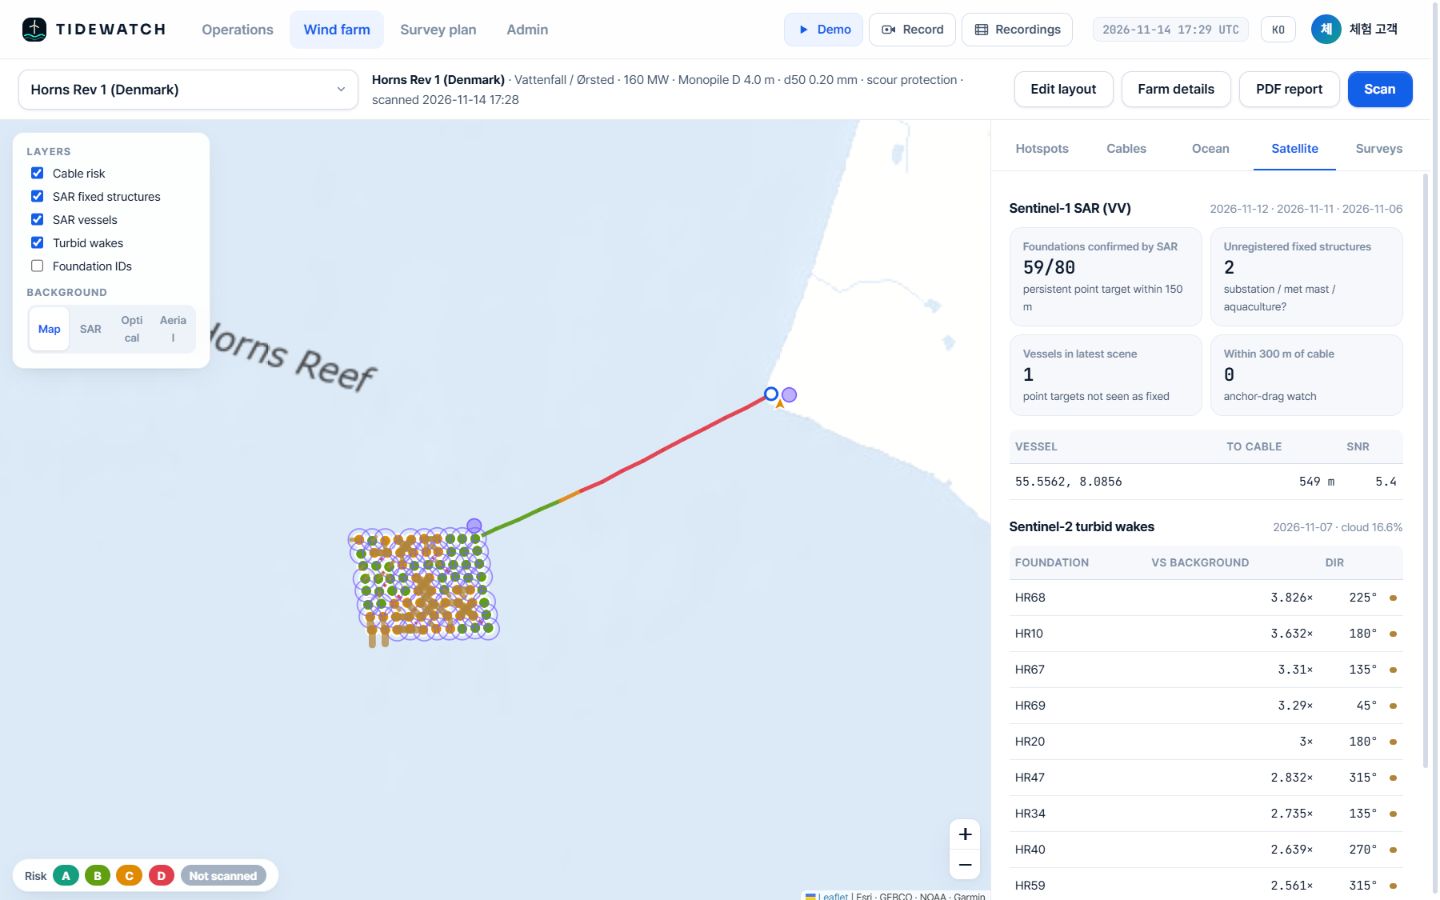
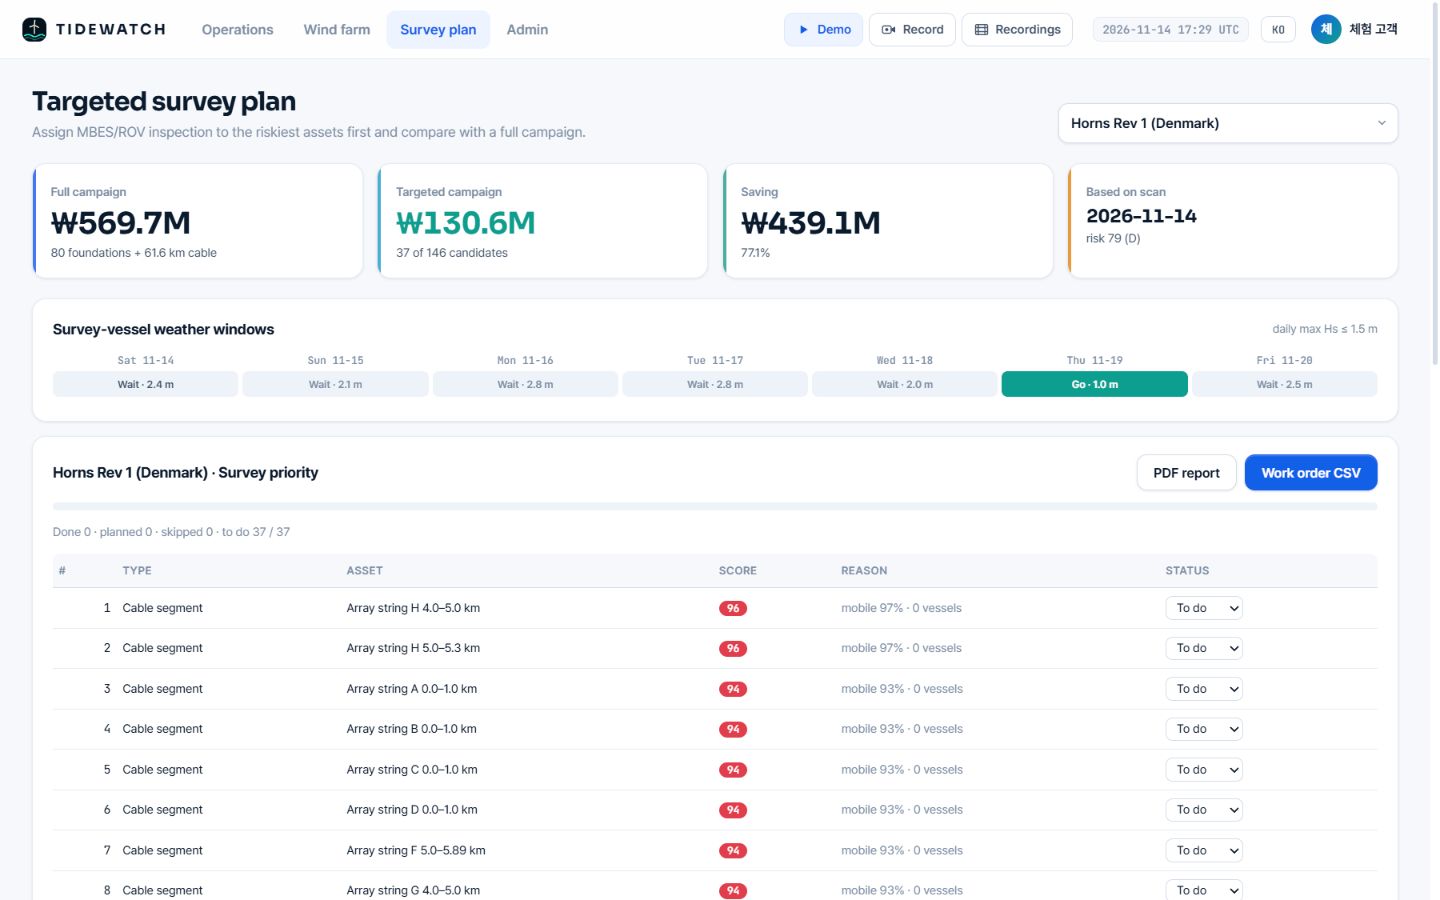
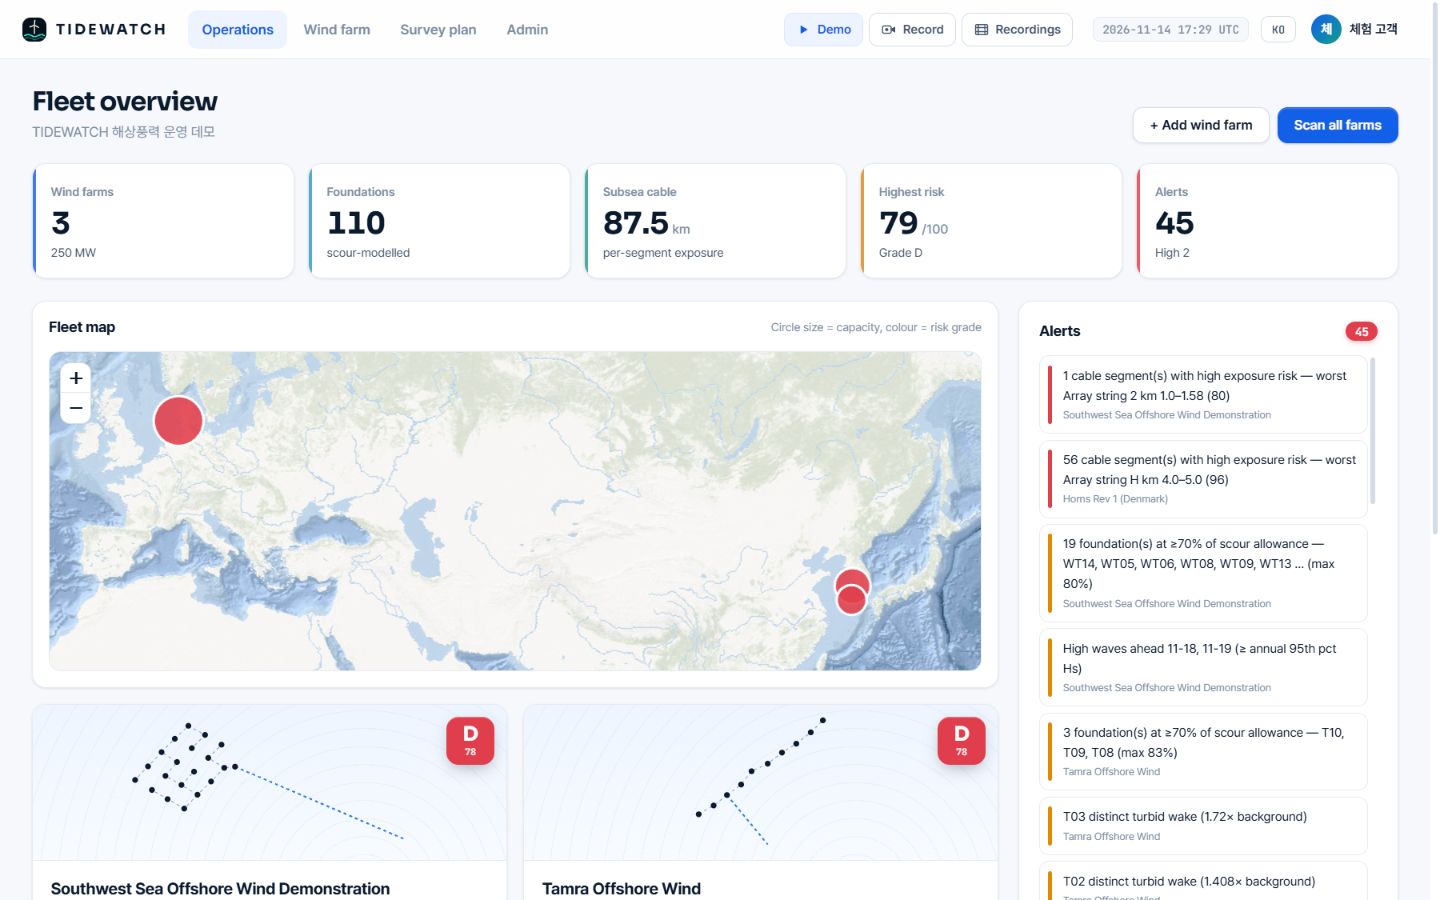
Southwest Sea
Korean interface
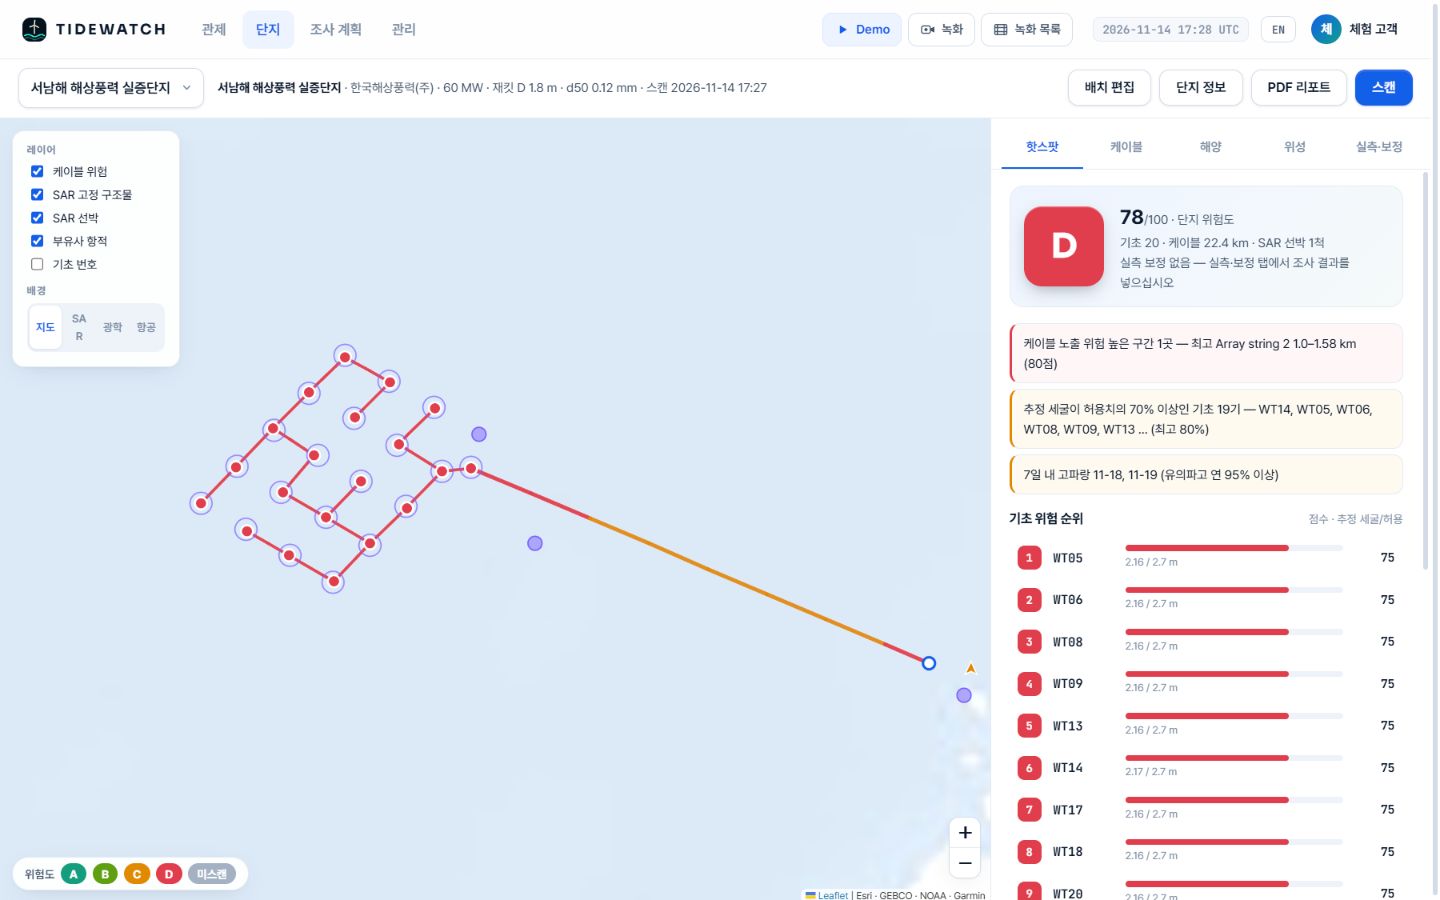
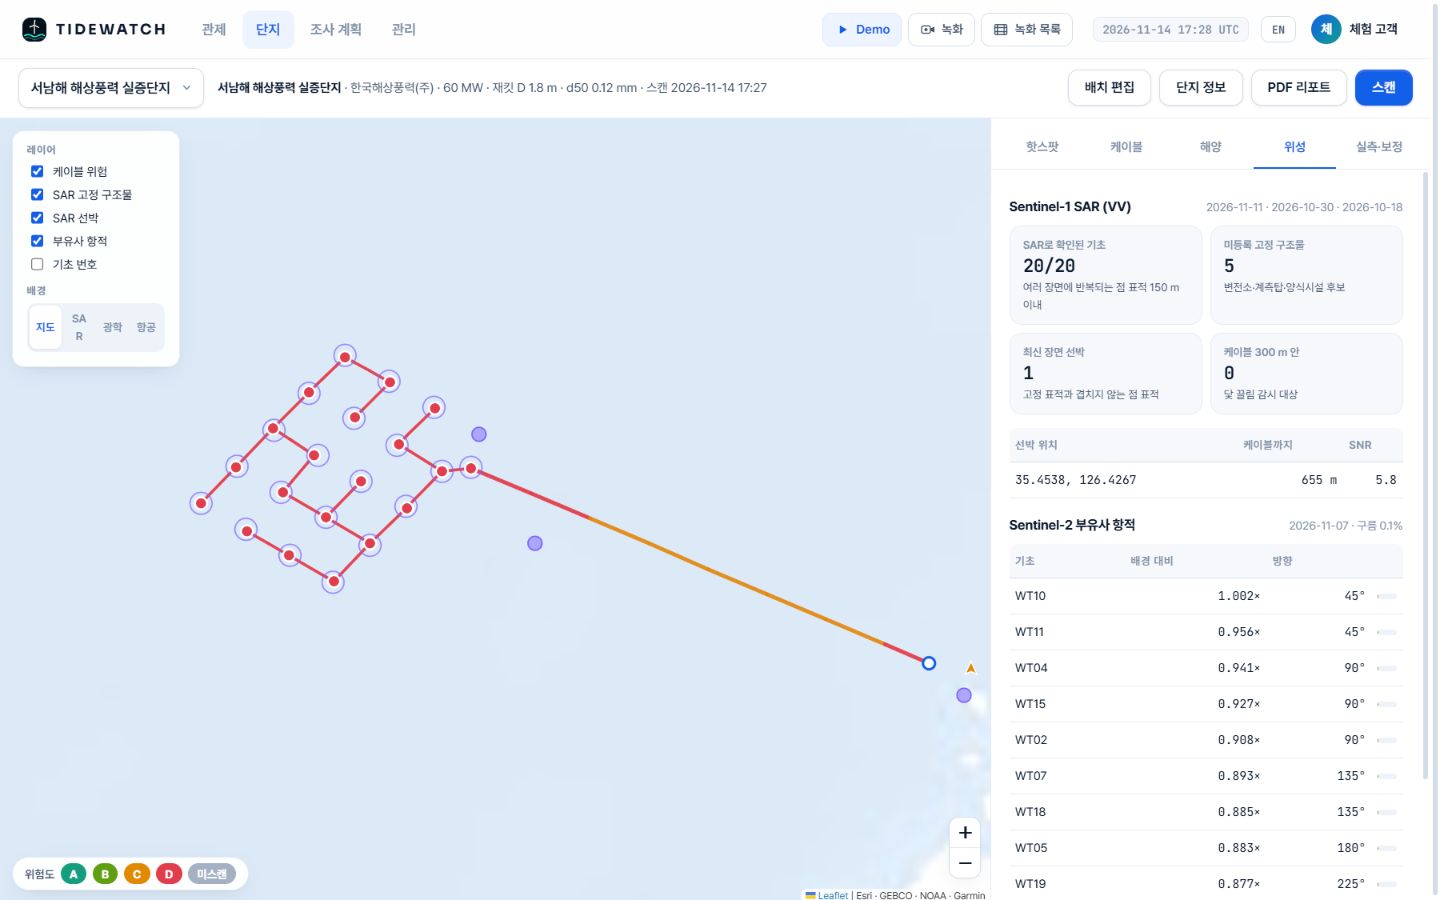
Jacket D 1.8 m, d50 0.12 mm. SAR confirmed 20 of 20 foundations and 5 unregistered fixed structures; 1 vessel 655 m from the cable.
Related pages
Pilot analysis
Send us the wind farm name. We send back a first report.
Tell us the location, number of turbines and foundation type. We build the layout from satellite detection and return a first report with scour per foundation, exposure risk per cable segment and a survey priority list.