How the sea behaved, and whether you can go out this week.
For every farm we collect a year of hourly waves, currents and tides plus a 7-day forecast. They drive the scour and cable models, and also give storm alerts and survey-vessel windows.
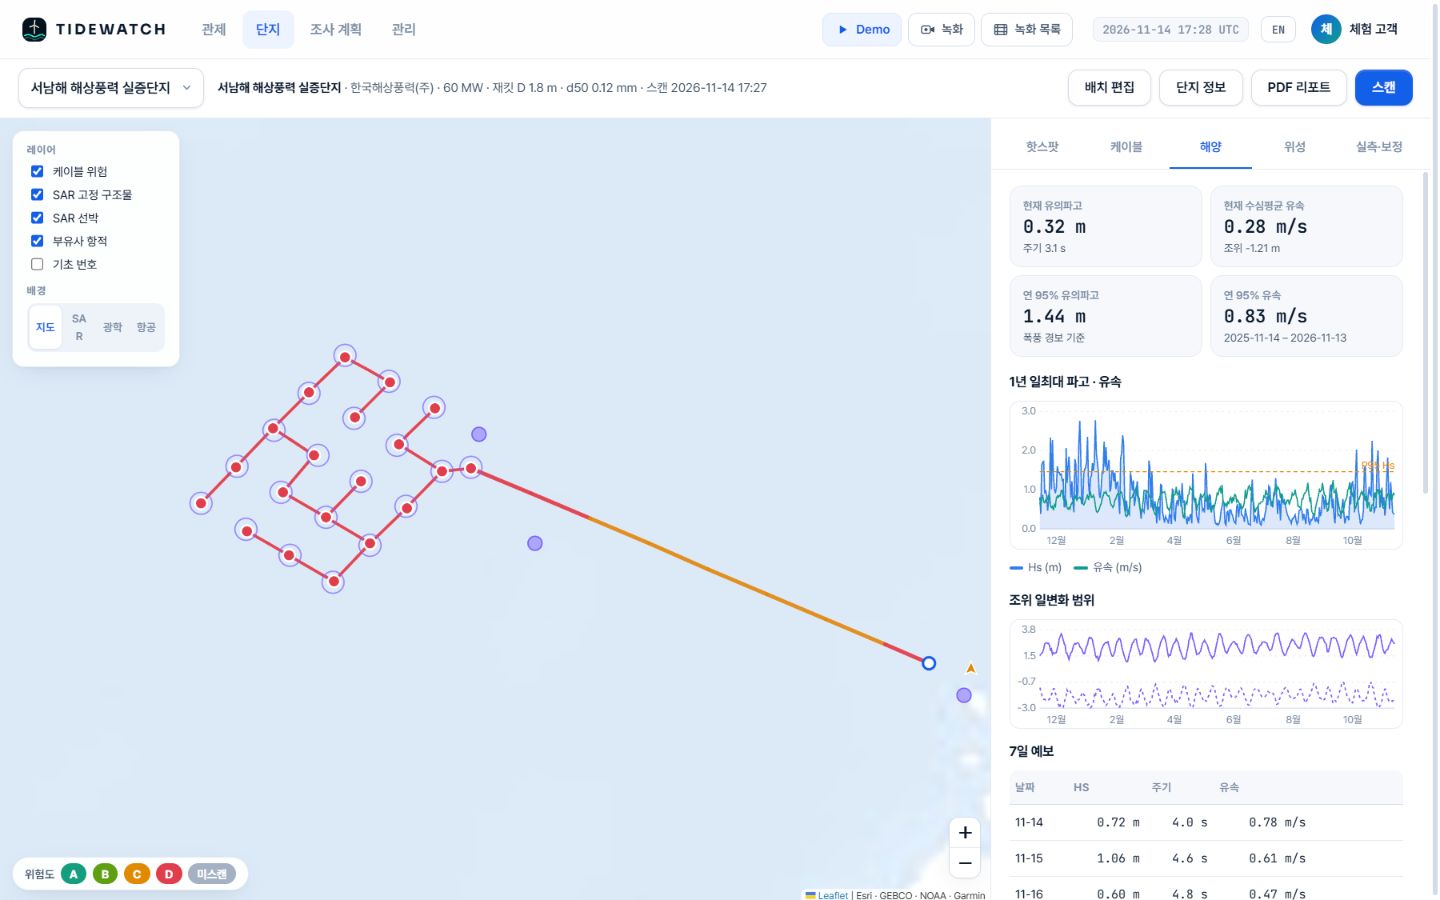
Metocean tab
Now, the past year, the next 7 days.
In the Southwest Sea demo the annual 95th percentile was 1.44 m significant wave height and 0.83 m/s current (14 Nov 2025 – 13 Nov 2026), which set the storm alert level.
- Current Hs and period, depth-averaged current, tide level
- Annual 95th percentile Hs and current (storm alert level)
- Daily max wave and current for a year; daily tidal range
- 7-day forecast: Hs, period and current per day
Weather windows
Plan the survey vessel 7 days ahead.
Days when the daily maximum significant wave height stays at or below the vessel limit (1.5 m by default) are marked Go. Read them with the risk ranking and the survey schedule falls into place.
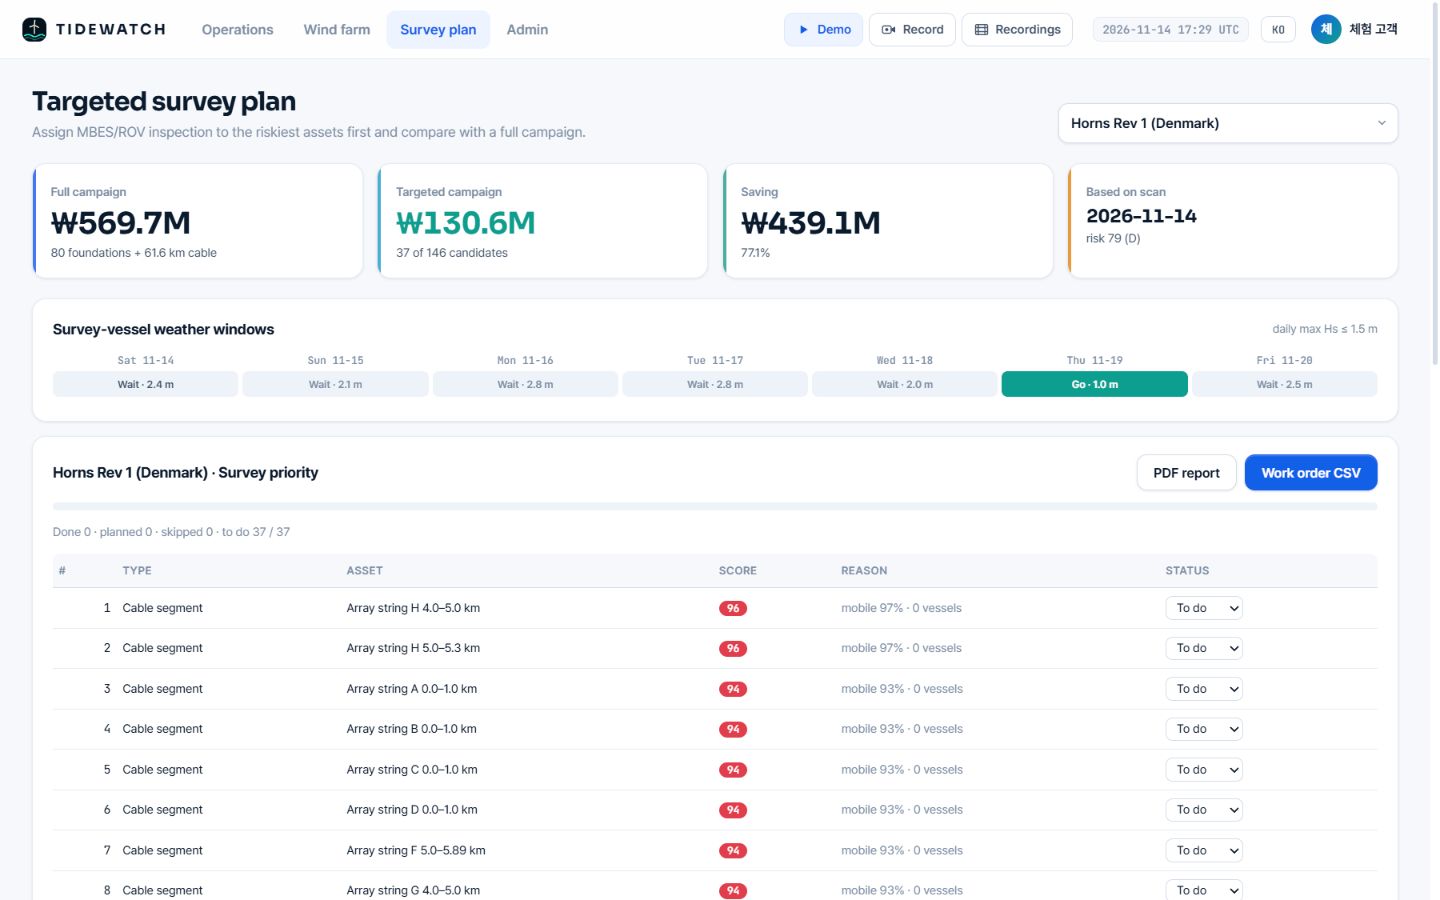
Demo screen, forecast of 14 Nov 2026. The Southwest Sea demo had 6 of 7 days open; Horns Rev 1 had one.
Specification
Data
| Data | Use | Resolution · cadence |
|---|---|---|
| Open-Meteo Marine | Significant wave height, period, direction, currents, tide for one year + 7-day forecast | about 5–8 km · hourly |
| GMRT (GEBCO + multibeam) | Water depth per foundation and cable segment | about 100–450 m |
Can we use our own metocean data?
Yes. If you have site wave and current measurements or model results, we agree how to use them.
Can the 1.5 m limit be changed?
The default is a daily max Hs of 1.5 m. The right limit for your vessel and task is agreed during the pilot analysis.
Related pages
Pilot analysis
Send us the wind farm name. We send back a first report.
Tell us the location, number of turbines and foundation type. We build the layout from satellite detection and return a first report with scour per foundation, exposure risk per cable segment and a survey priority list.