A first screening from the farm name.
Public satellite and ocean data cover the world. Once the layout is built from satellite detection, any farm can get a first report on the same yardstick.
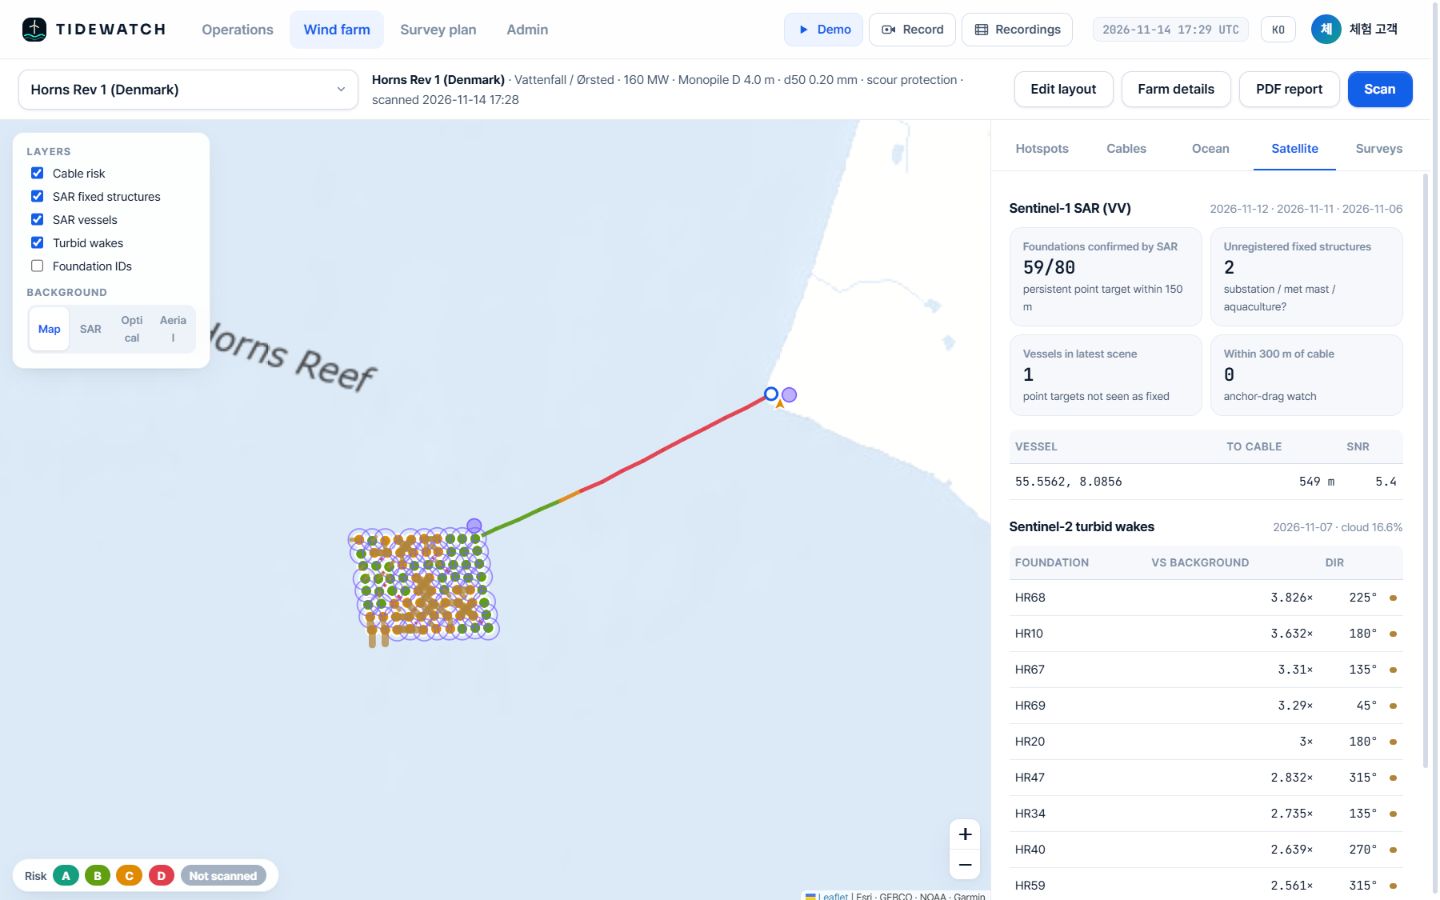
Example
Horns Rev 1 in Denmark, the same way.
The demo includes Horns Rev 1 (160 MW, 80 monopiles, 61.6 km of cable). Its layout comes from public information and satellite detection; it is not operator data or a deployment.
- First look at subsea risk during acquisition due diligence
- Share results with overseas PoC partners on the same screen
- Korean and English interface
Related pages
Pilot analysis
Send us the wind farm name. We send back a first report.
Tell us the location, number of turbines and foundation type. We build the layout from satellite detection and return a first report with scour per foundation, exposure risk per cable segment and a survey priority list.