Exposed segments and vessels, on one map.
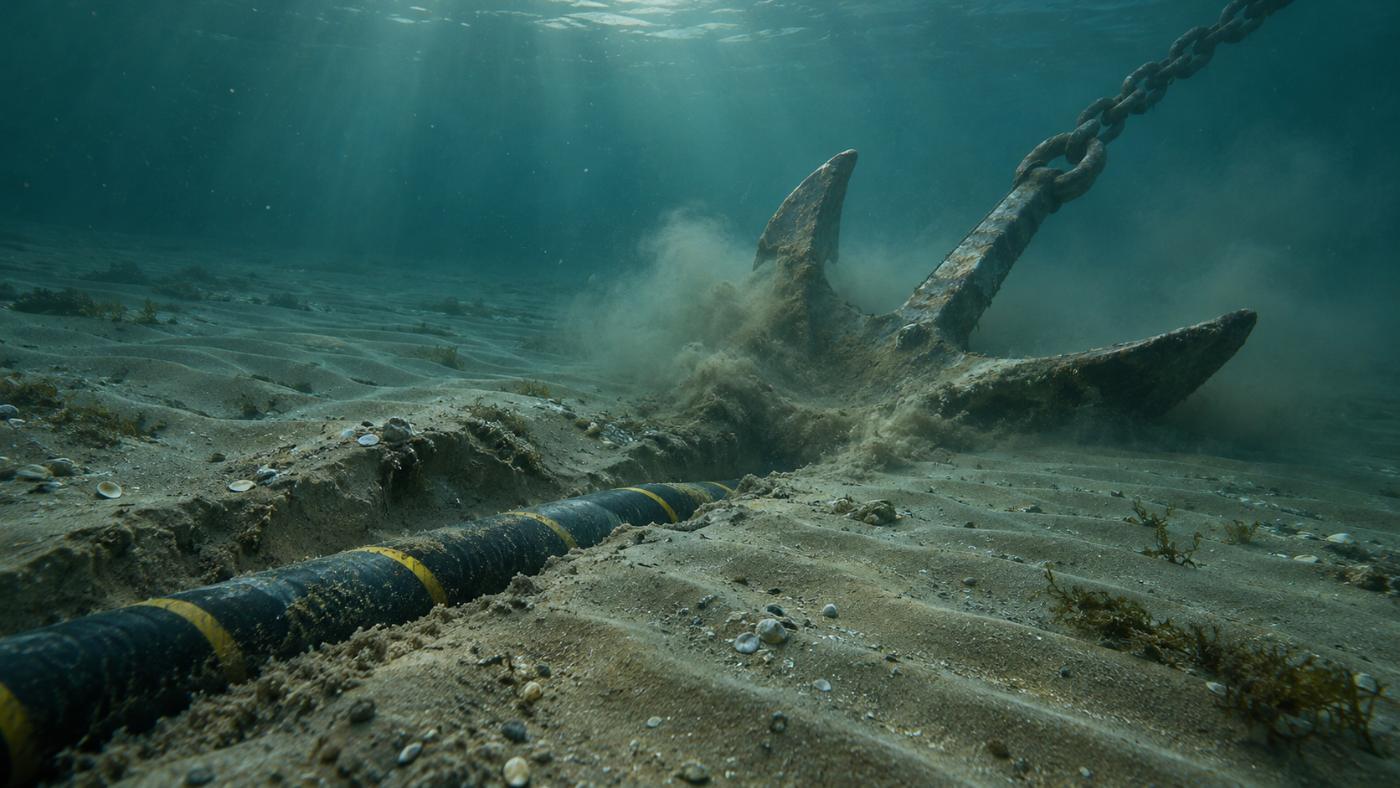
Many cable incidents come from anchors and fishing gear. TIDEWATCH shows where moving sand is likely to thin the cover, and which vessels sat above the cable.
Cable management
Manage by segment, not by length.
Each segment is scored as seabed mobility × burial depth × vessel proximity. Survey the riskiest kilometres first, and tell operations about segments where vessels keep stopping.
- Exposure score and ranking per segment
- SAR vessels within 300 m of cables (anchor-drag watch)
- Calibration with past burial depth and exposure records
- Segments handed over in a work-order CSV
Related pages
Pilot analysis
Send us the wind farm name. We send back a first report.
Tell us the location, number of turbines and foundation type. We build the layout from satellite detection and return a first report with scour per foundation, exposure risk per cable segment and a survey priority list.