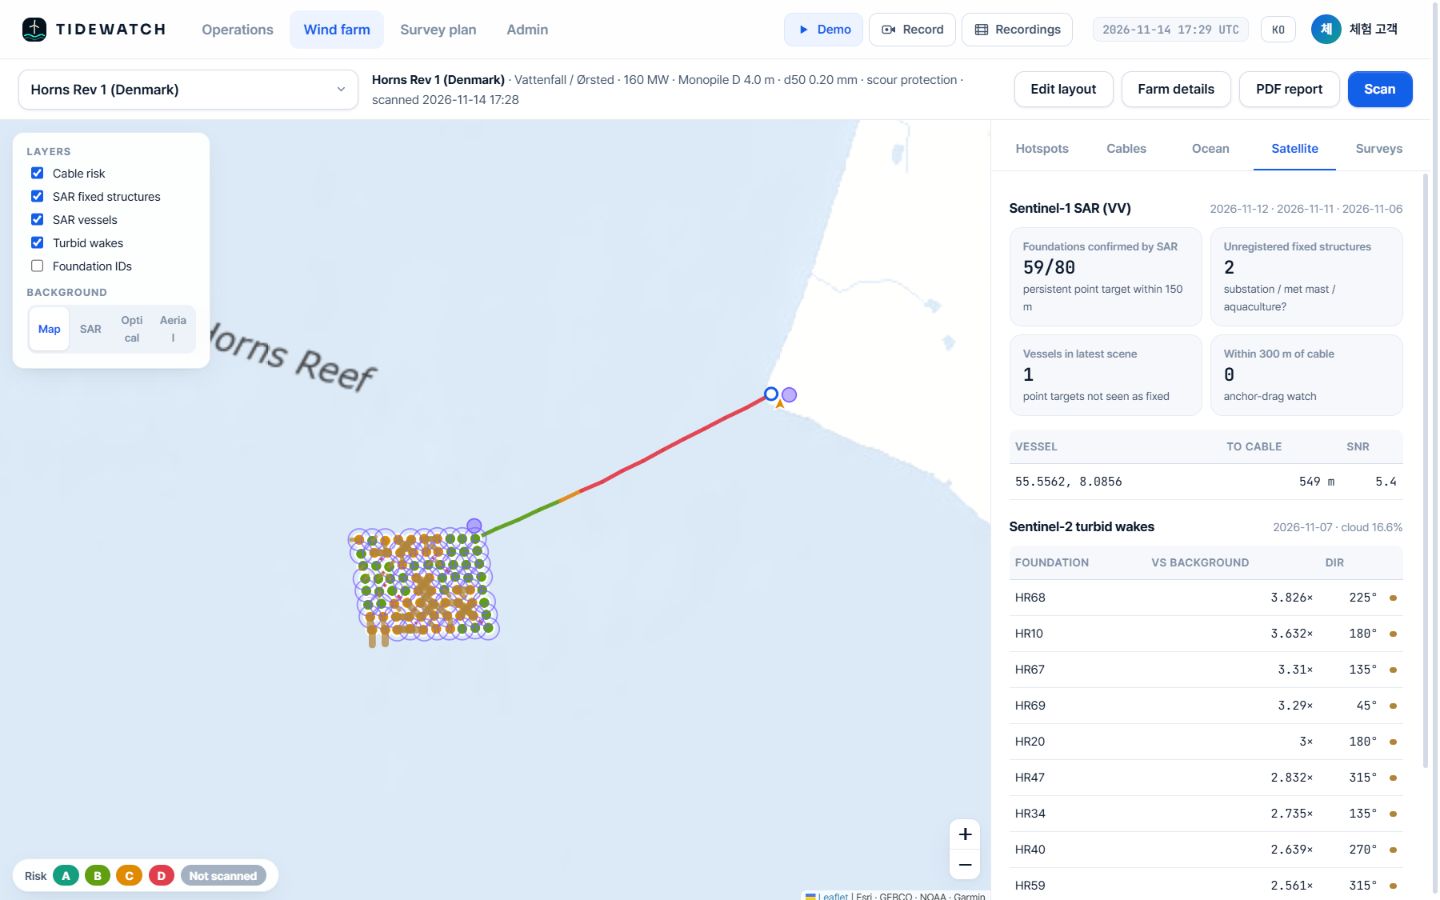
You can’t see under water. You can see the risk first.
TIDEWATCH computes scour at every foundation from a year of waves, currents and tides plus a 7-day forecast, spots vessels near cables with Sentinel-1 radar and sediment plumes behind foundations with Sentinel-2. Send the ROV and survey vessel only where the risk is high.
The problem
Drones inspect what is above water. Below it, you still send a ship.
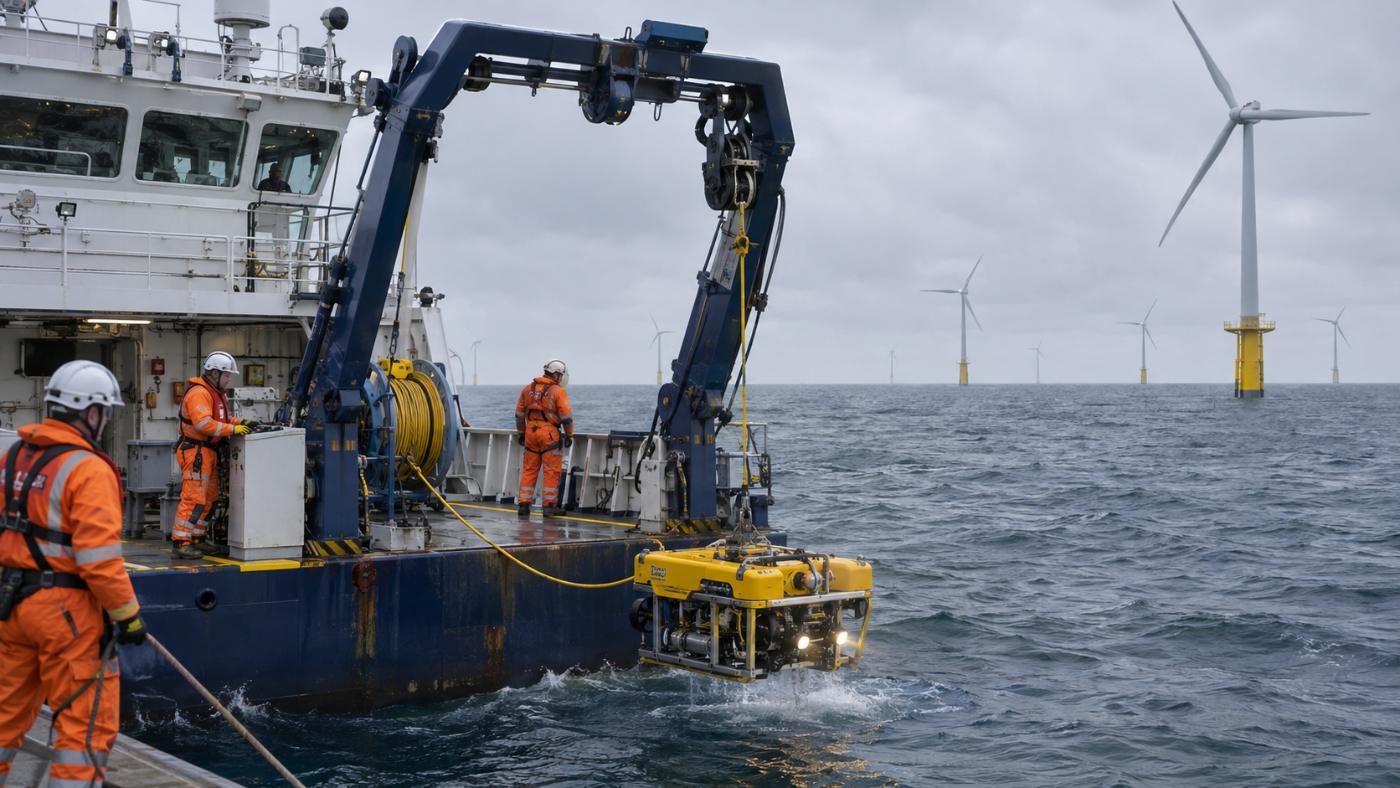
The subsea assets of an offshore wind farm are its foundations and cables. You cannot see them, and checking them means a survey vessel and an ROV.
Costly routine surveys
Sending MBES vessels and ROVs across the whole farm on a fixed cycle is a large share of operating cost.
The gap after storms
Scour and cable exposure develop fast during storms and spring tides, yet nothing tells you until the next routine survey.
Third-party damage
Many cable incidents come from anchors and fishing gear. There are few ways to keep an eye on vessels above cables.
The product
110 foundations and 87.5 km of cable on one screen.
A demo scan of three seed farms (250 MW). Every farm gets an A–D grade, a 100-point risk score, alerts and a 7-day survey-vessel weather window.
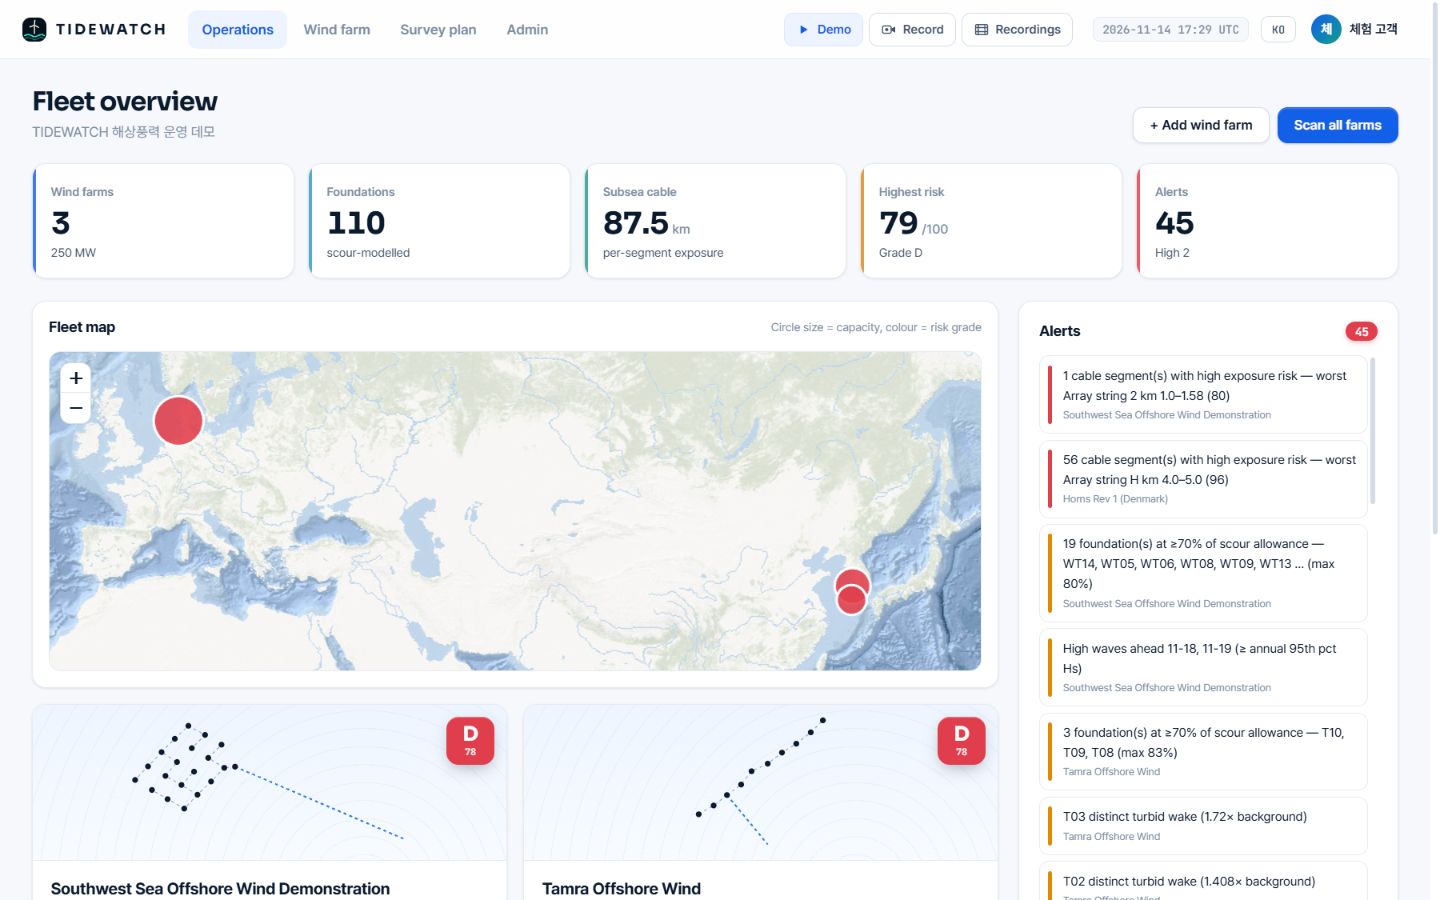
Real TIDEWATCH screen (demo account). Pilot calculations for three seed farms built from public information (Southwest Sea demonstration farm and Tamra in Korea, Horns Rev 1 in Denmark). They are not customer deployments.
Features
Screen, add evidence, narrow the survey.
Physics models driven by ocean data, indirect evidence from satellites, then a survey plan and calibration with your measurements.
Foundation scour estimate
Equilibrium scour and share of allowance at every foundation, from Soulsby and Sumer–Fredsøe.
Cable exposure risk
A score per segment: seabed mobility × burial depth × vessel proximity.
Satellite evidence
SAR separates fixed structures from vessels; optical imagery catches sediment plumes.
Metocean and weather windows
A year of hourly waves, currents and tides plus a 7-day forecast for storm alerts and vessel windows.
Targeted survey plan
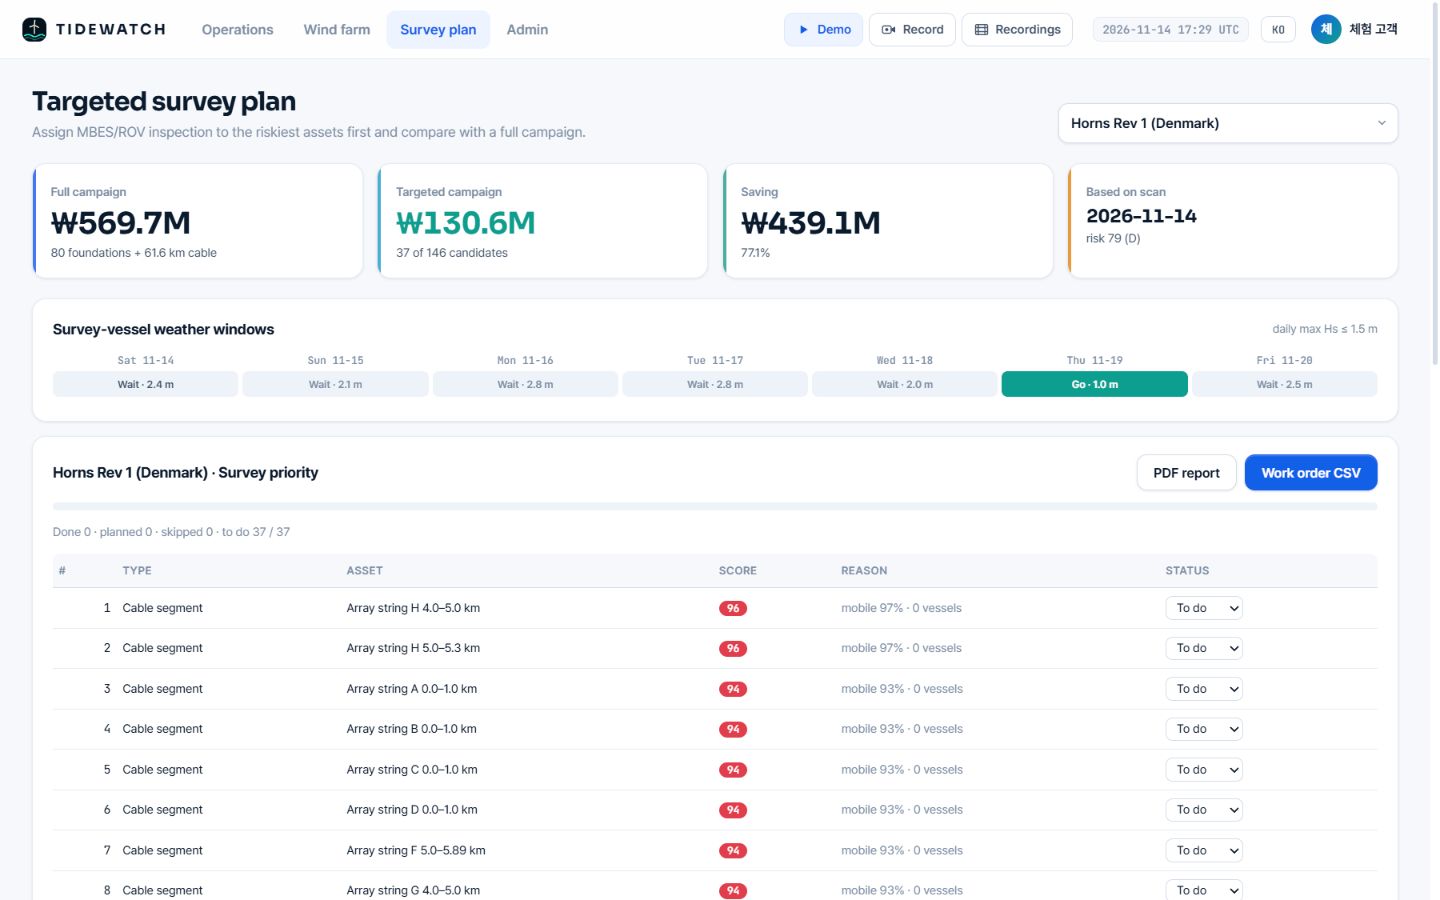
Priority list, saving, PDF report and work-order CSV for the riskiest assets.
Calibrated with your surveys
Add MBES and ROV results; the model fits your site and the next survey gets narrower.
How it works
Screen with satellites and ocean models. Calibrate with measurements.
01 Register the farm
Turbine positions are detected automatically from point targets that repeat across Sentinel-1 scenes. Cable routes are estimated from the layout or imported from as-built drawings.
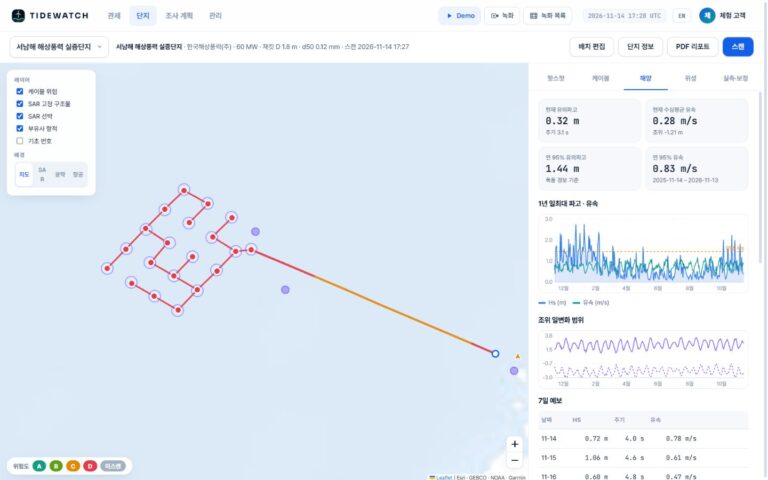
02 Compute ocean forcing
A year of hourly waves, currents and tides plus GMRT bathymetry give bed shear and equilibrium scour at every foundation and seabed mobility along every cable segment.
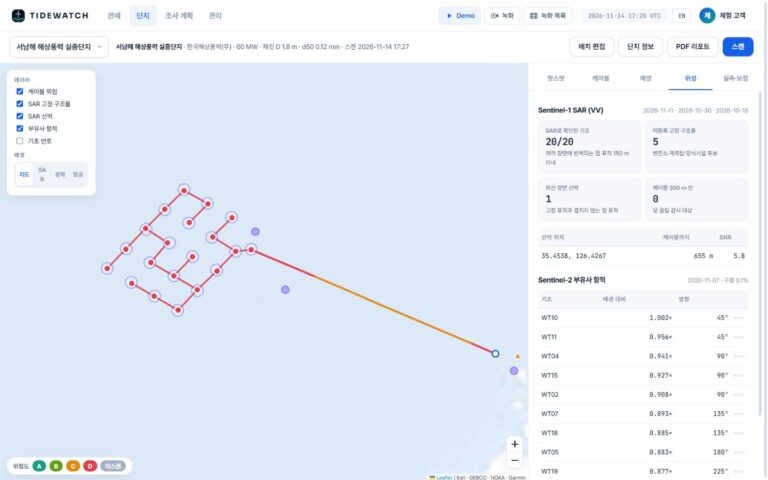
03 Add satellite evidence
Radar picks up vessels near cables; optical imagery picks up sediment plumes behind foundations. Both feed into the model risk.
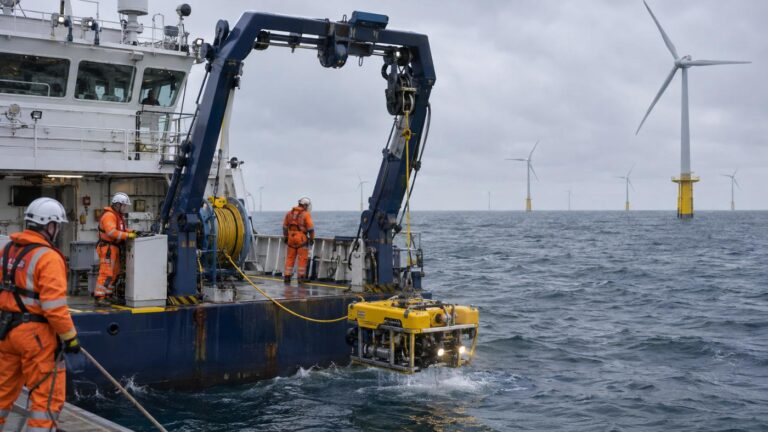
04 Survey and calibrate
Survey only the riskiest assets. Feed the results back and the model fits your site; the next campaign gets narrower.
Only public satellite and ocean data, and proven engineering formulas
Live product
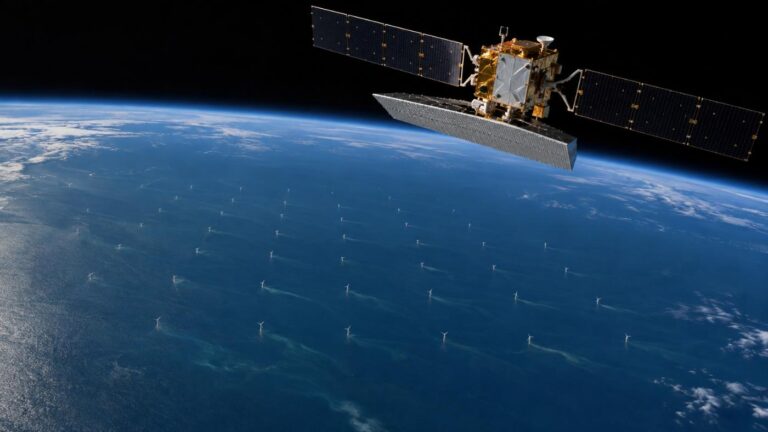
Open a farm and every foundation and cable is coloured by risk.
Switch between map, SAR, optical and aerial backgrounds and read foundation ranking, cable segments, metocean, satellite evidence and calibration in tabs.
Who it is for
Built for the teams responsible for subsea assets.
Wind farm O&M, cable owners, post-storm checks and new or overseas farms use the same platform and the same yardstick.
- Wind farm O&M: routine survey scope by risk
- Subsea cable protection: exposure and vessels together
- After storms: an instant priority list
- New and overseas farms: first screening from the farm name
Why TIDEWATCH
It does not replace surveys. It narrows them.
Routine MBES and ROV surveys are accurate but costly and infrequent. TIDEWATCH fills the time in between, across the whole farm, with ocean models and satellites.
| Full routine survey | Permanent sensors | TIDEWATCH | |
|---|---|---|---|
| Coverage | Whole farm on survey day | Instrumented points | Every foundation and cable segment |
| Update | Fixed cycle (e.g. yearly) | Continuous | Ocean daily, SAR 6–12 days, optical 5 days |
| Right after a storm | Gap until next survey | Instrumented points only | Re-scan for a new ranking |
| Vessels and anchors | None | Usually none | SAR vessels within 300 m of cables |
| Cost | Vessel and ROV for the whole farm | Install and maintain | No site equipment; survey only top assets |
| Accuracy | Measured (reference) | Measured (points) | Screening, calibrated with measurements |
General characteristics; actual farms and contracts vary. Full comparison
Pilot calculation
54–77% lower survey cost on three seed farms.
Farm layouts from public information and demo unit costs. We compared a full campaign with surveying only the top 25% riskiest assets plus anything over its allowance or with exposure of 90 or more.
Southwest Sea demonstration farm
60 MW · 20 jackets · 22.4 km cable
12 targets of 47 candidates
69.5% saving
Horns Rev 1 (Denmark)
160 MW · 80 monopiles · 61.6 km cable
37 targets of 146 candidates
77.1% saving
Tamra Offshore Wind
30 MW · 10 jackets · 3.5 km cable
4 targets of 15 candidates
54.2% saving
Demo scan of 14 Nov 2026. These are pilot calculations in a demo account, not the operators’ actual survey costs. Unit costs can be changed in Admin, and statutory or insurance surveys should continue for all assets.
The company
A team that runs AI on industrial sites.
TIDEWATCH is built by MomentCube, an industrial AI company. We combine the AI monitoring we run at power and safety sites with satellite and ocean data.
3 lead R&D projects
Switchgear predictive maintenance, context-aware AI safety, Safety4Cut with NVIDIA.
3 registered patents
Industrial AI safety, autonomous equipment management, automatic reports.
Public site operation
AI fire and safety monitoring at Incheon Environmental Corporation.
Venture company
Innovation growth type, dedicated R&D department.
FAQ
Frequently asked questions
What is TIDEWATCH?
TIDEWATCH is MomentCube’s subsea risk screening service for offshore wind. It computes scour at every foundation and exposure risk along every cable segment from ocean data, adds indirect evidence from satellite radar and optical imagery, and ranks where MBES and ROV surveys should go first.
Can satellites see the seabed?
No. Satellites see the sea surface and what is above it. Scour and exposure are computed from ocean forcing; satellites add indirect evidence such as vessels, structures and sediment plumes. The result is a survey priority, not a survey measurement.
Can we add our own farm data?
Yes. As-built turbine coordinates, cable routes, foundation type and diameter, sediment grain size, burial depth and past MBES/ROV results all improve accuracy.
How often is it updated?
Ocean data daily, Sentinel-1 every 6–12 days and Sentinel-2 every 5 days on clear days. You can re-scan at any time.
Can we stop routine surveys?
No. TIDEWATCH narrows the campaign. Keep statutory and insurance surveys for all assets.
Do we need equipment on site?
No. It starts from public satellite and ocean data and runs in a web browser.
Insights
TIDEWATCH blog
Cutting offshore wind subsea survey costs with targeted surveys
How to target MBES and ROV surveys by risk, the savings on three demo farms, and the rules for using it alongside…
Subsea cable exposure and anchor drag: what satellites can and cannot see
Why offshore wind cables become exposed, why anchors matter, and how radar satellites spot vessels near cables, with their limits.
Offshore wind foundation scour: compute it before you send the survey vessel
Why scour forms around offshore wind foundations, how to estimate it from wave and current data, and how to calibrate the calculation…
Pilot analysis
Send us the wind farm name. We send back a first report.
Tell us the location, number of turbines and foundation type. We build the layout from satellite detection and return a first report with scour per foundation, exposure risk per cable segment and a survey priority list.