Cutting offshore wind subsea survey costs with targeted surveys
If you own the O&M budget, the most practical way to cut cost is to narrow offshore wind subsea survey scope by risk.
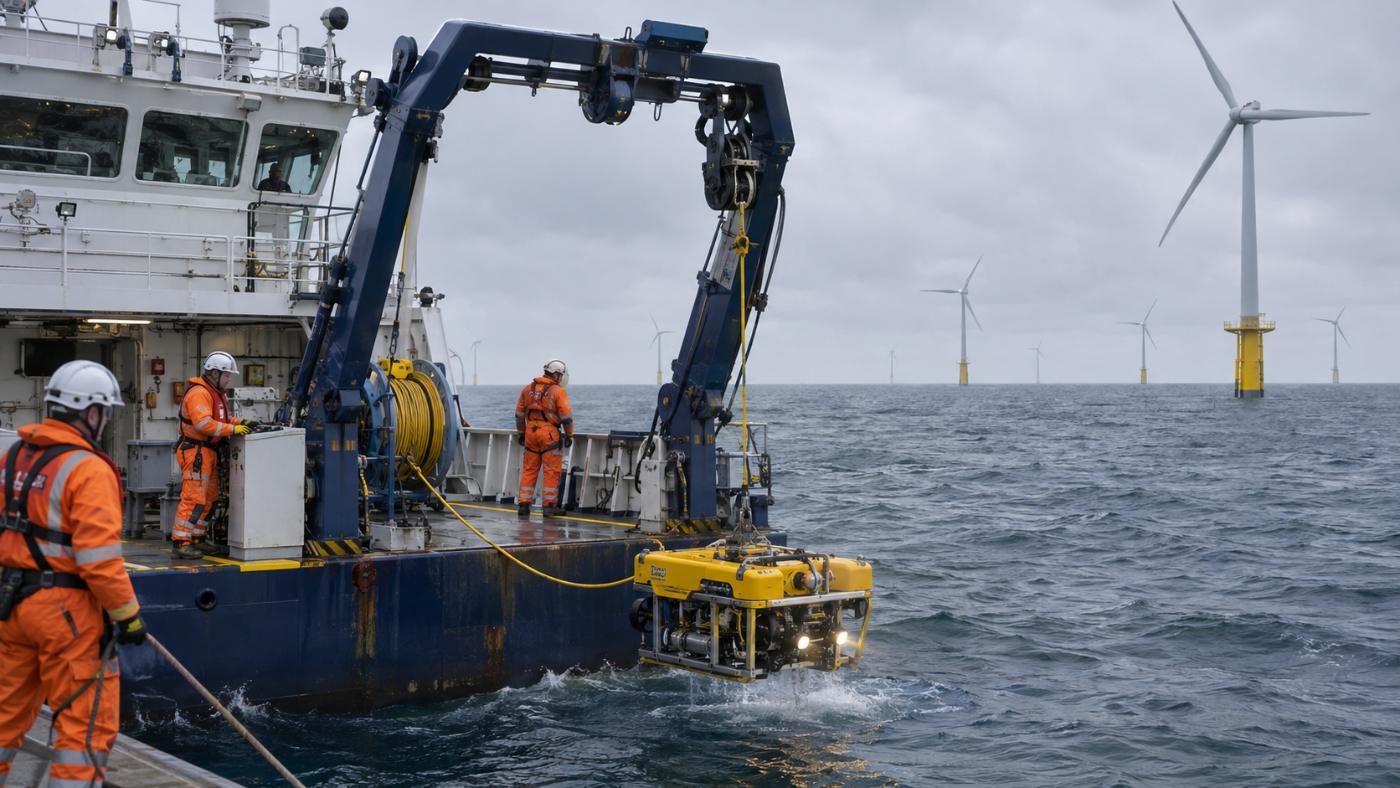
Subsea surveys move vessels, equipment and people together. A survey vessel sweeps the farm with multibeam and puts an ROV down where needed. It can only go out when the weather allows, so schedules stretch easily.
Yet not every foundation and cable segment carries the same risk. Places with strong flow, mobile sand or frequent traffic need more frequent and detailed checks; the rest may be fine on the routine cycle.
Below we cover why survey costs grow, how targets are chosen, the results on three demo farms, and how to use it within weather windows and routine survey rules. If you are planning your next survey budget, take a look.
Category: O&M & surveys
Offshore wind subsea survey costs grow quickly with farm size
Subsea survey cost scales with the number of targets. More foundations and longer cables mean more area for the vessel to sweep, more points for the ROV to visit and more days of vessel hire.
Weather adds cost as well. On days with high waves the vessel cannot work, and waiting days are paid for too. If a planned campaign cannot be finished in one go, the vessel has to go out again.
To see the most important places more often on the same budget, you first need to know where the risk is. If risk is uneven, it makes sense for the survey to be uneven too.
The question is what to base that choice on. Past survey results do not show the effect of storms since then, and personal experience struggles to cover every foundation and segment as farms grow. You need a basis that recomputes the whole farm on the same yardstick.
Building a targeted survey plan
Score foundation scour and cable exposure.
Top 25% plus anything over the limits.
Full vs. targeted campaign cost.
Hand over a PDF report and a work-order CSV.
A targeted survey starts with the assets at the top of the risk ranking
TIDEWATCH scores scour risk for each foundation and exposure risk for each cable segment, then merges them into one ranking. The scores come from physics models driven by waves, currents and tide from Open-Meteo Marine, plus satellite evidence such as vessels detected by Sentinel-1 radar.
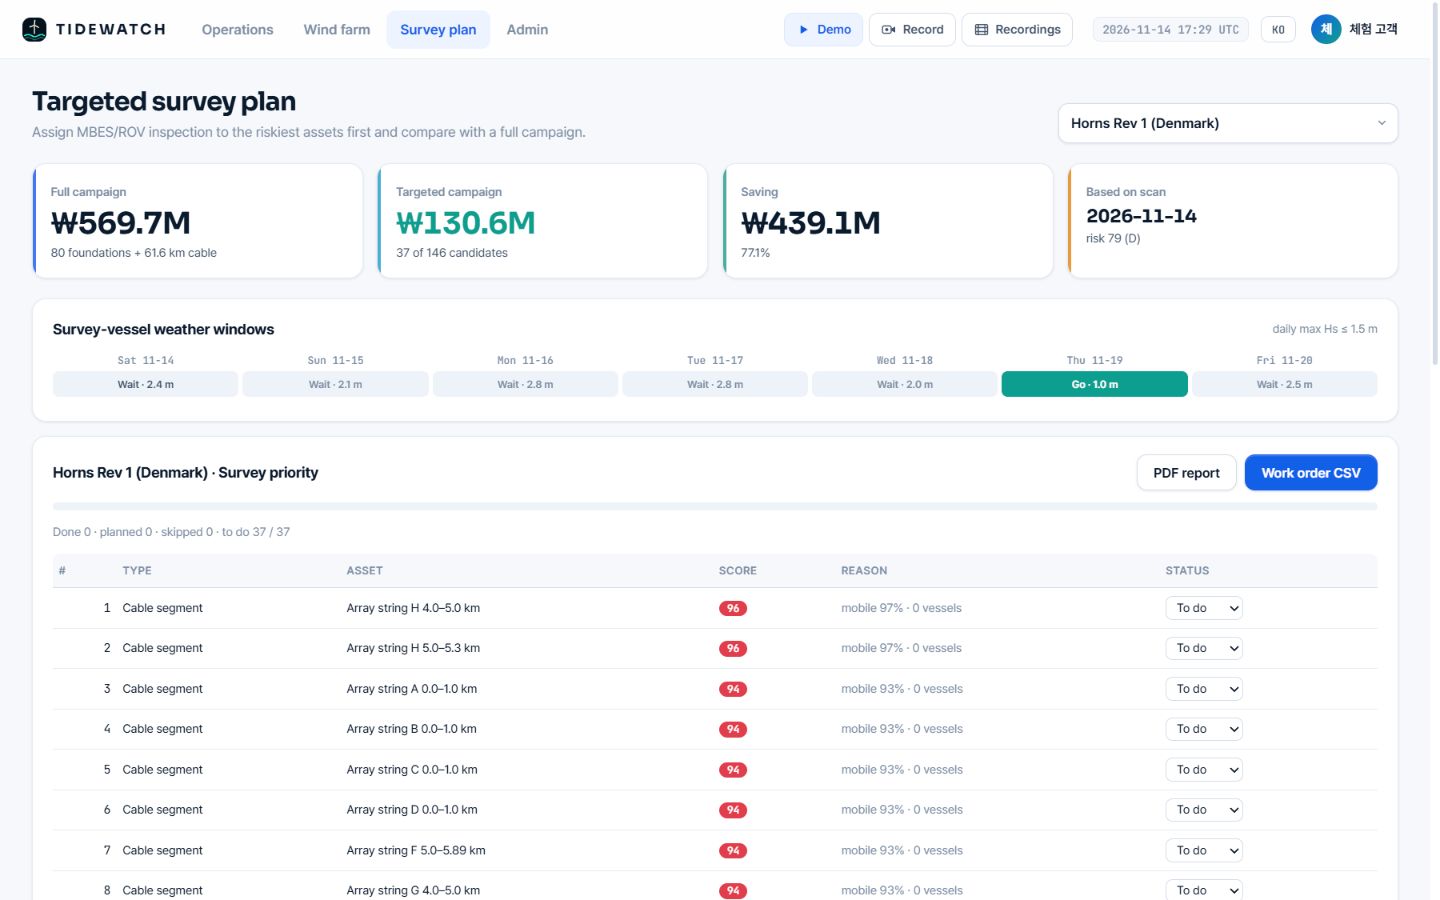
The plan includes the riskiest 25% of assets plus anything over its scour allowance or with an exposure score of 90 or more. That rule makes sure assets over a limit are never left out because of their rank.
It then compares the cost of a full campaign with the targeted one at the same unit costs, which you can set to your contract rates so the numbers stay close to your real budget.
Every target comes with its reasons: estimated scour against allowance for foundations, and seabed mobility, nearby vessels and burial depth for cable segments. Contractors and staff can see on the same screen why each place comes first. Water depth starts from public bathymetry such as GMRT and is replaced by farm data where available.
Offshore wind subsea survey cost fell by 54–77% on three demo farms
These are calculations for three seed farms built from public information, at demo unit costs. The Southwest Sea demonstration farm (60 MW) went from ₩182.2M for a full campaign to ₩55.6M targeted, a 69.5% saving, and Tamra (30 MW) from ₩80.5M to ₩36.9M, 54.2%.
Horns Rev 1 in Denmark (160 MW) went from ₩569.7M to ₩130.6M, 77.1%. Across these three, the larger the farm, the larger the saving, because risk tends to concentrate in some segments and the rest can stay on the routine cycle.
These are pilot calculations with demo rates and defaults, not the operators’ actual survey costs. Real savings depend on farm size, risk distribution, contract rates and statutory cycles.
Targeted surveys work within weather windows and routine survey rules
A plan only works if the sea allows. TIDEWATCH marks days in the 7-day forecast when the daily maximum significant wave height stays at or below the vessel limit (1.5 m by default). In the forecast of 14 Nov 2026, the Southwest Sea demo had 6 of 7 days open while Horns Rev 1 had one.
There is also a key rule. Satellite and ocean model screening decides survey scope and order, so statutory and insurance surveys should continue for assets that are not high risk.
The loop must close as well: survey results go back into the model. The more you survey, the closer the computation gets to the site and the sharper the next selection.
We have covered why offshore wind subsea survey costs grow and how to narrow the scope by risk; the rule and outputs are described on the targeted survey plan page.
Frequently asked questions
Will our farm see a similar saving?
It depends on farm size, risk distribution, contract rates and statutory cycles. The first report computes it for your farm.
How does it connect to our survey contractor?
A work-order CSV hands over targets, order and reasons, and status is tracked as to do, planned, done or skipped.
Can it be used for urgent checks?
Yes. Re-scan after a storm and the ranking is recomputed to pick urgent targets.
Want to know which foundations and cable segments to survey first?
Send us the farm name. We build the layout from satellite detection and return a first screening report, then calibrate it with your survey records.
Request a pilot analysis →Edited and answered by the MomentCube TIDEWATCH team / james@momentcube.com · +82-32-212-1011